text visualizations
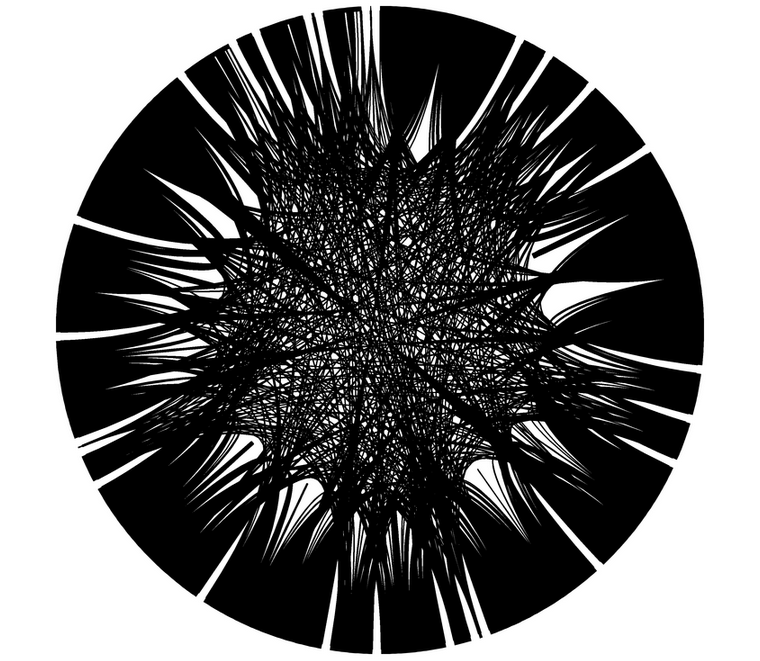
these visualizations were inspired by the work of martin krzynski and christian vasile who visualized the sequences of the digits after the decimal in pi. i decided it would be interesting to visualize the sequence of letters in text in a similar fashion. each segment around the circle represents a letter of the alphabet and each line represents a transition between subsequent letters. they were made using circos and python.
there seems to be a culturally imposed divide of skills that people can have: if you’re good at reading/writing then you’re probably not good at math; if you’re good at math then you’re probably not good at reading/writing. most of the focus is centered on improving the way we teach people math/programming and making technology more accessible to them as its use becomes more prevalent in the world. i was lucky that math always clicked for me in school and i enjoyed it enough to study it at university. however, knowing that i liked math imposed an inherent lack of ability to write - i was terrified of english and lit classes. it was strange for me though, because i loved to read. i didn’t really understand this disconnect fully until i reflected on this project. i made this visualization in pure curiosity; i didn’t really have a clear intention of why i was doing it at the time. after thinking more about it, i realized it was my attempt to make writing more math-y. this was the only way i could be comfortable with it. i hope to make further projects that try to make language more math-y, to help people like me and also other engineers for whom writing a paper was freaking huge deal in university.
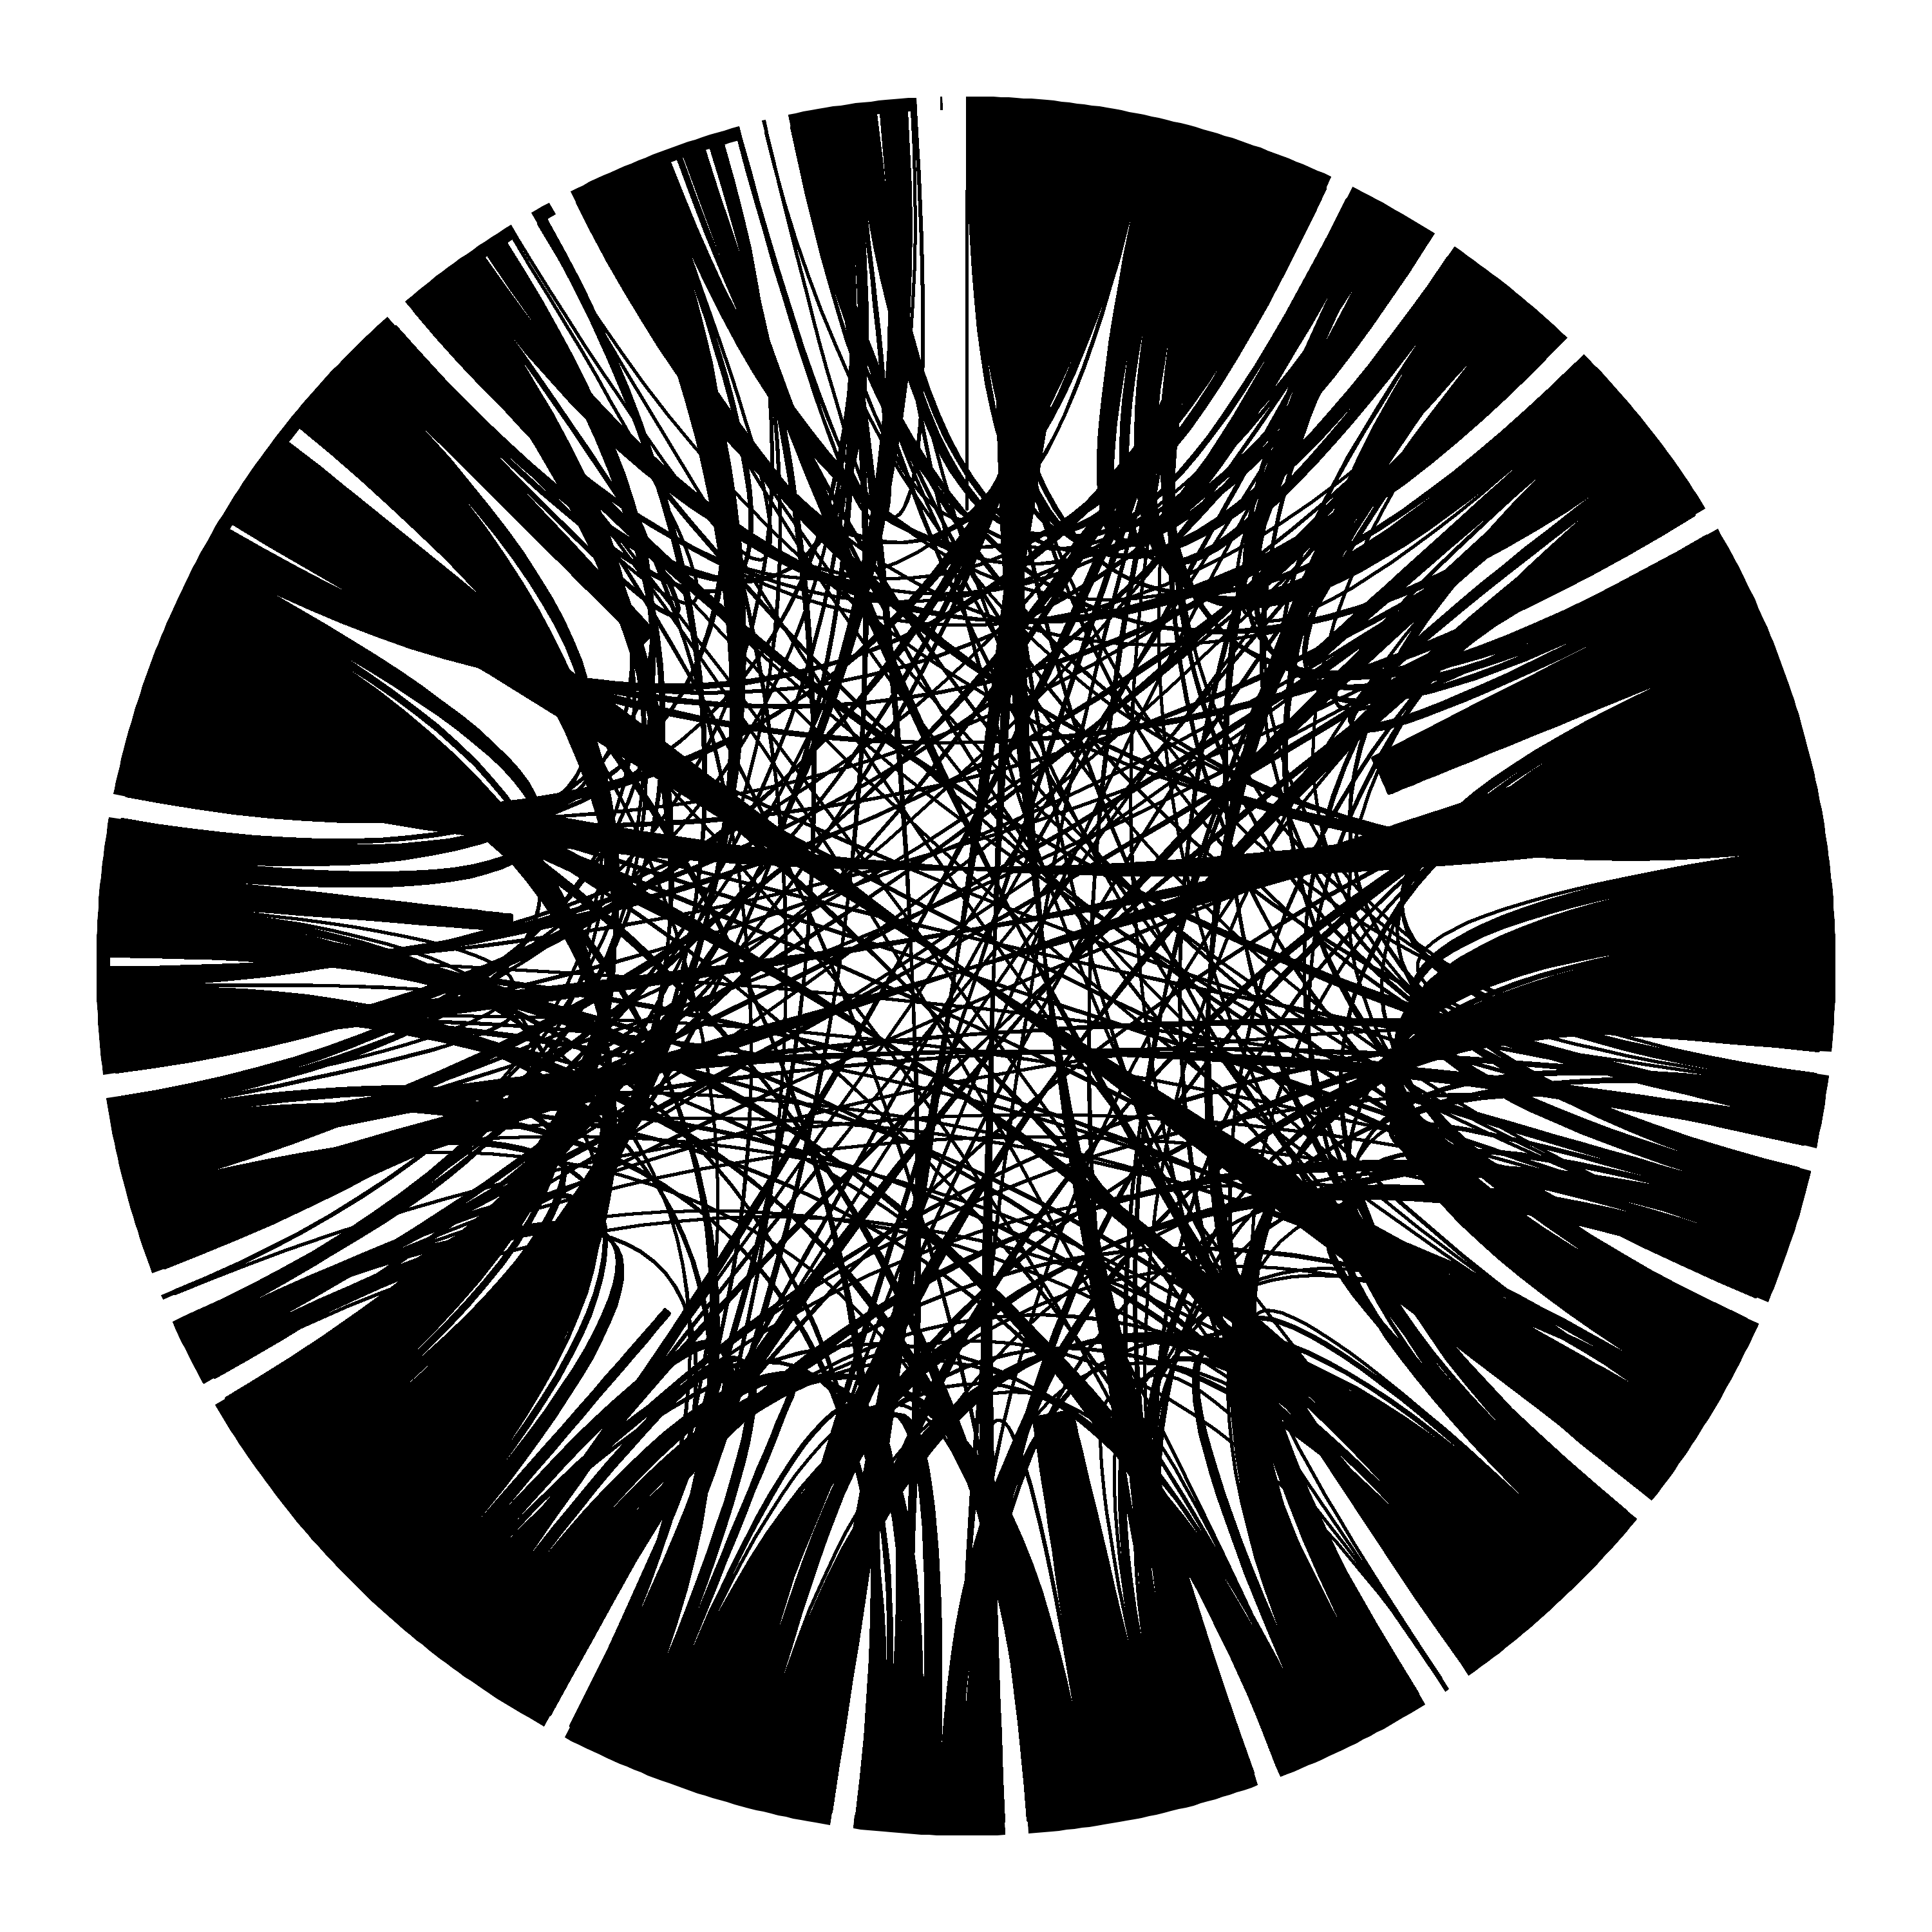
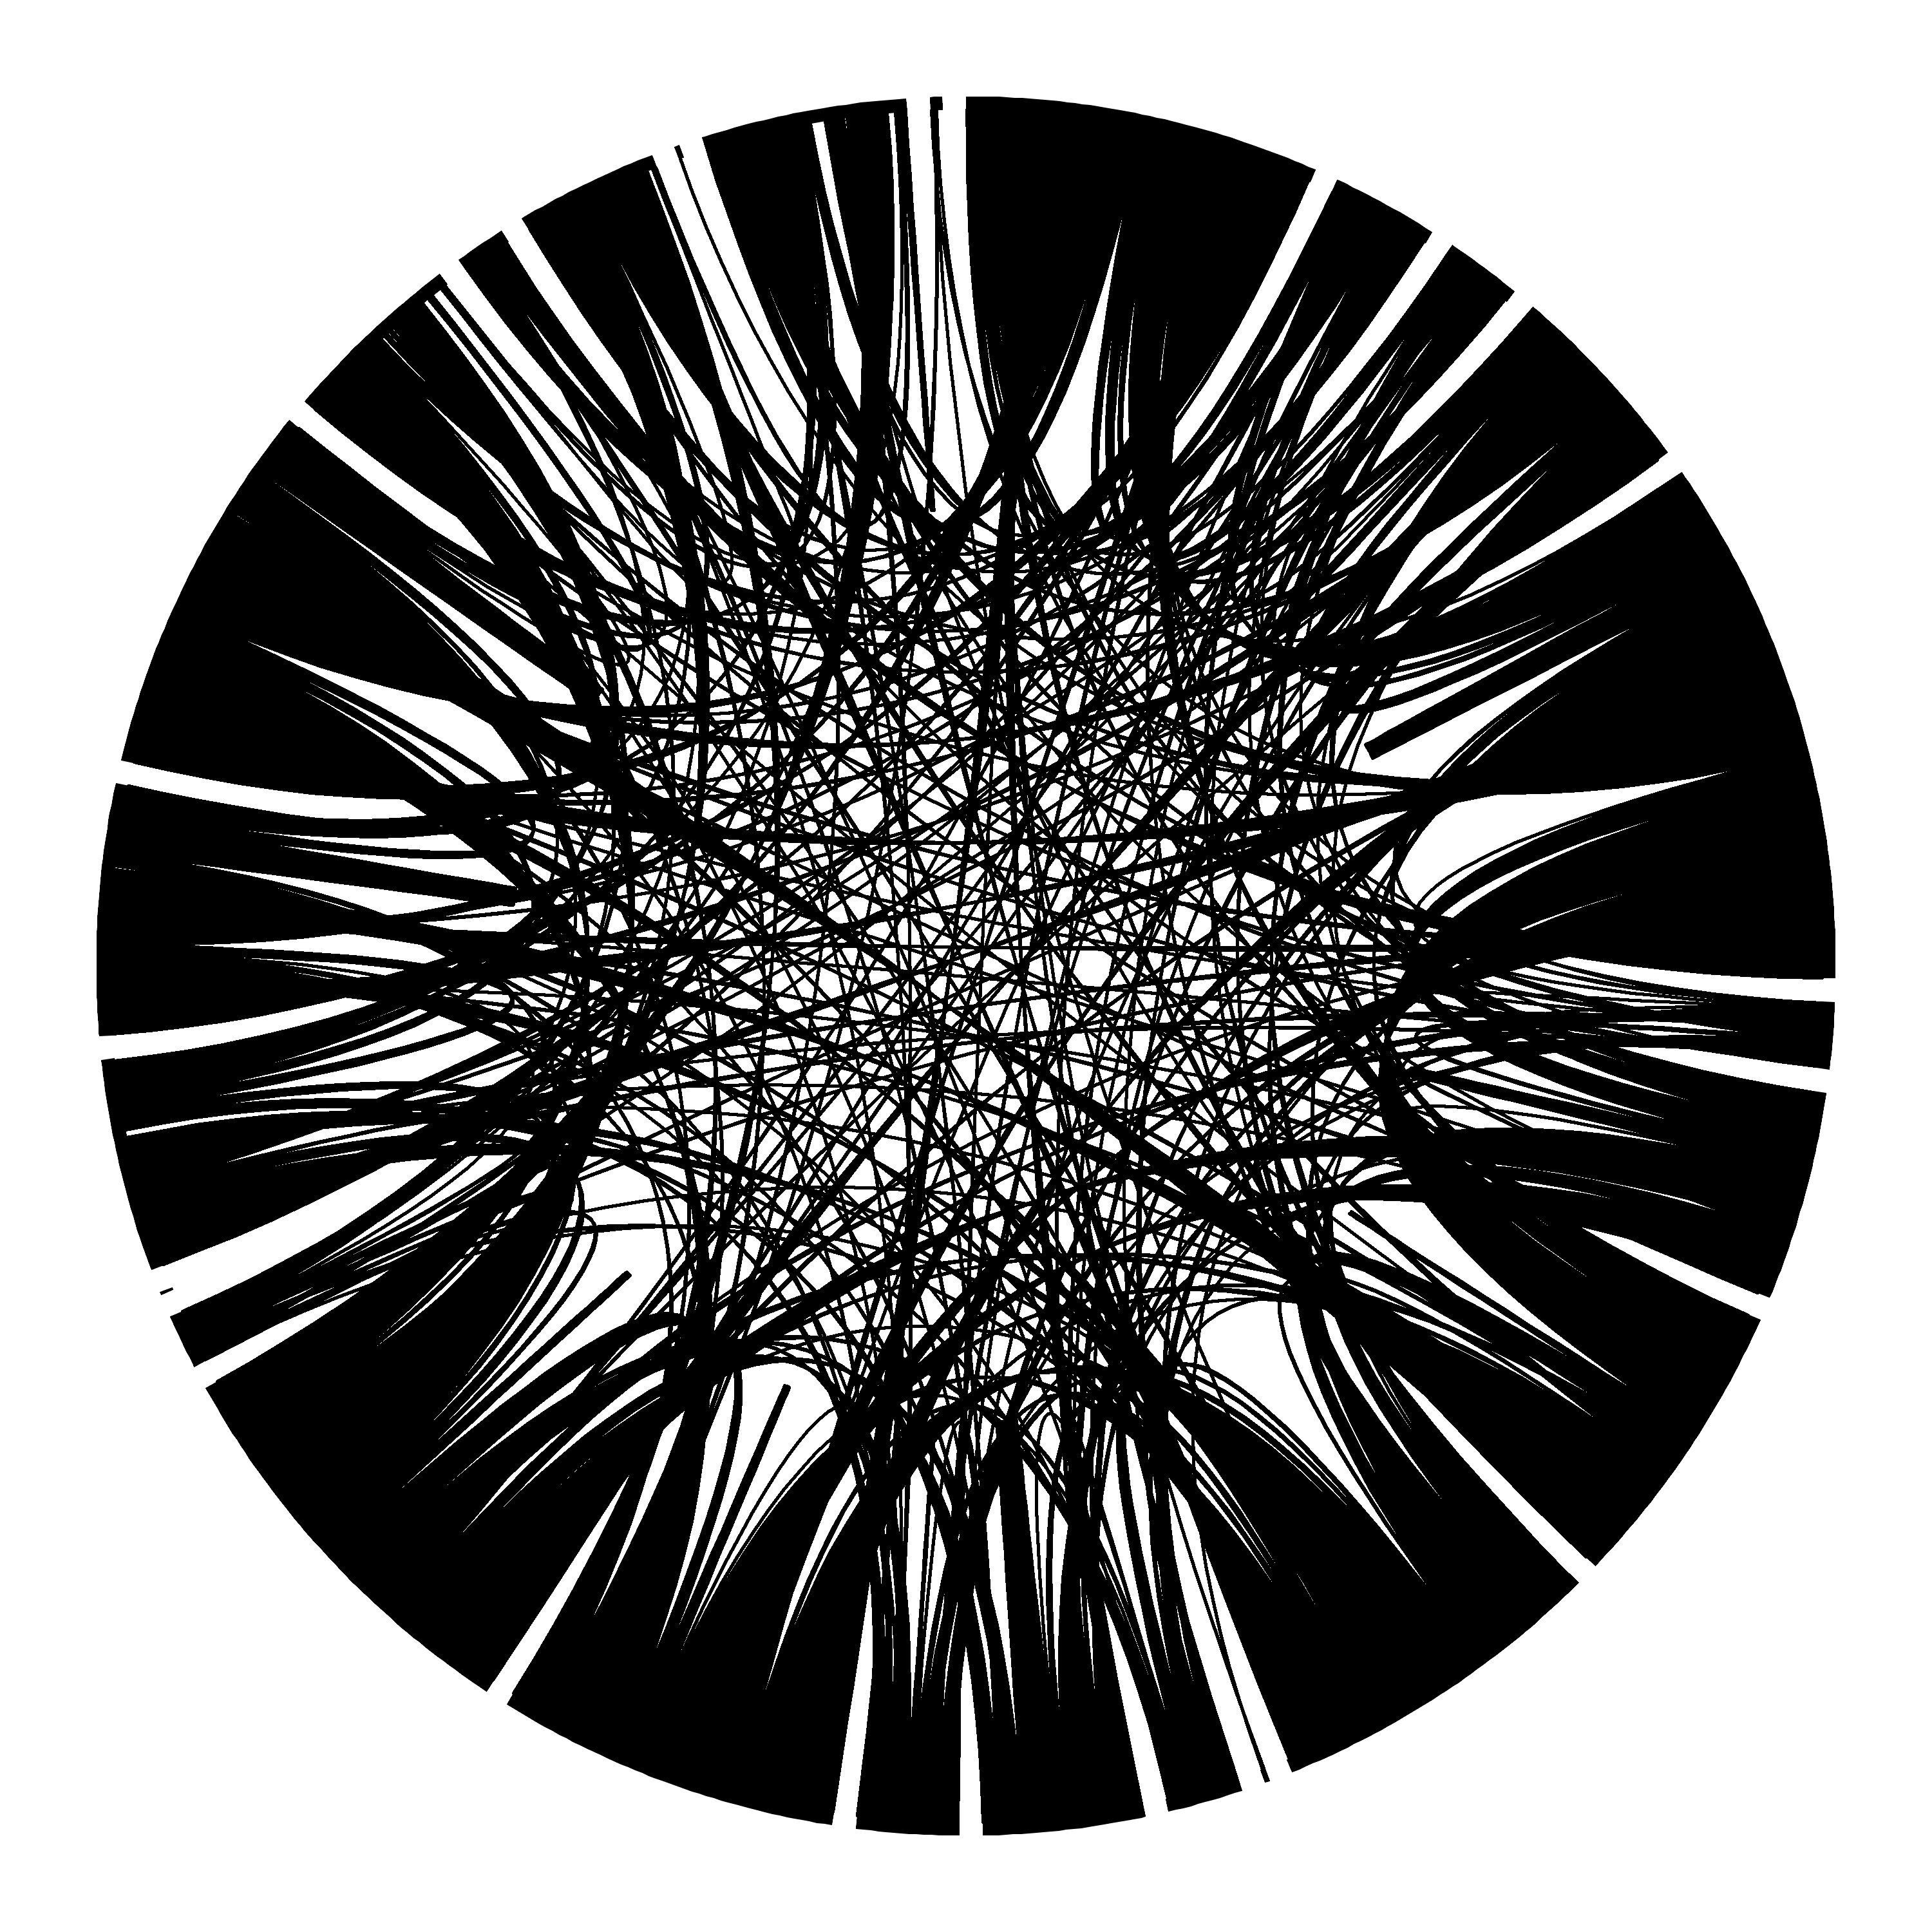
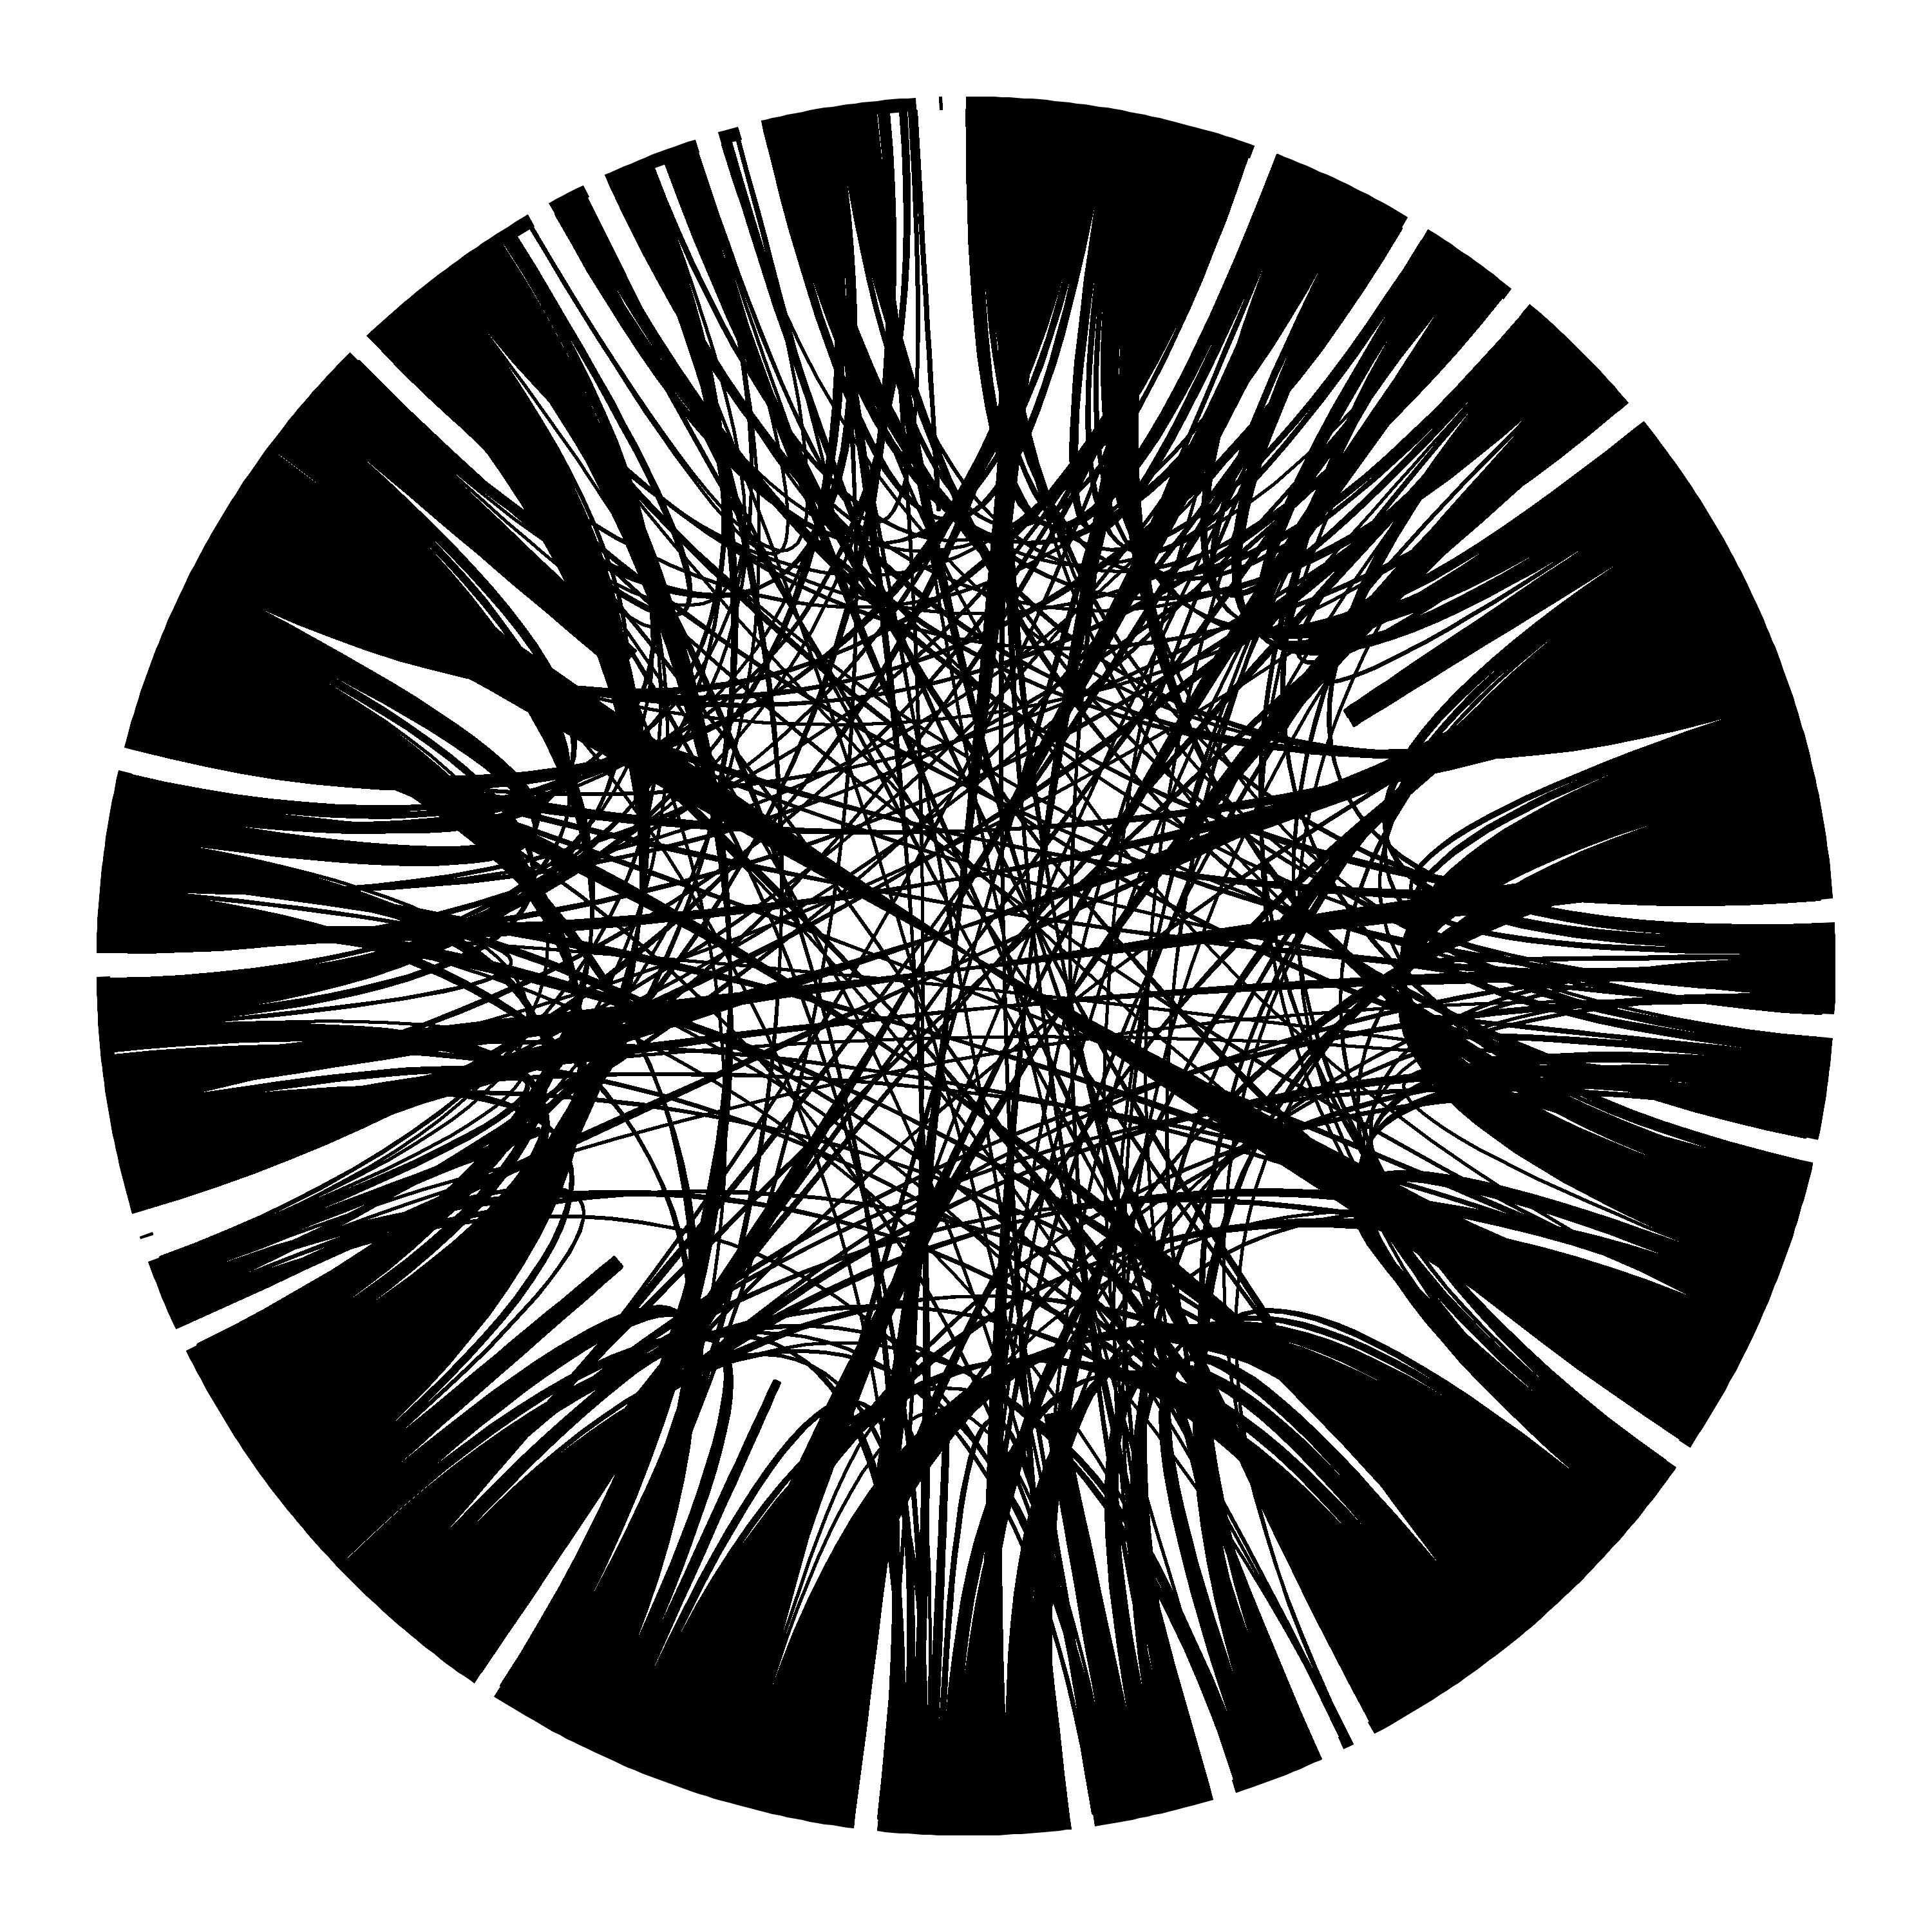
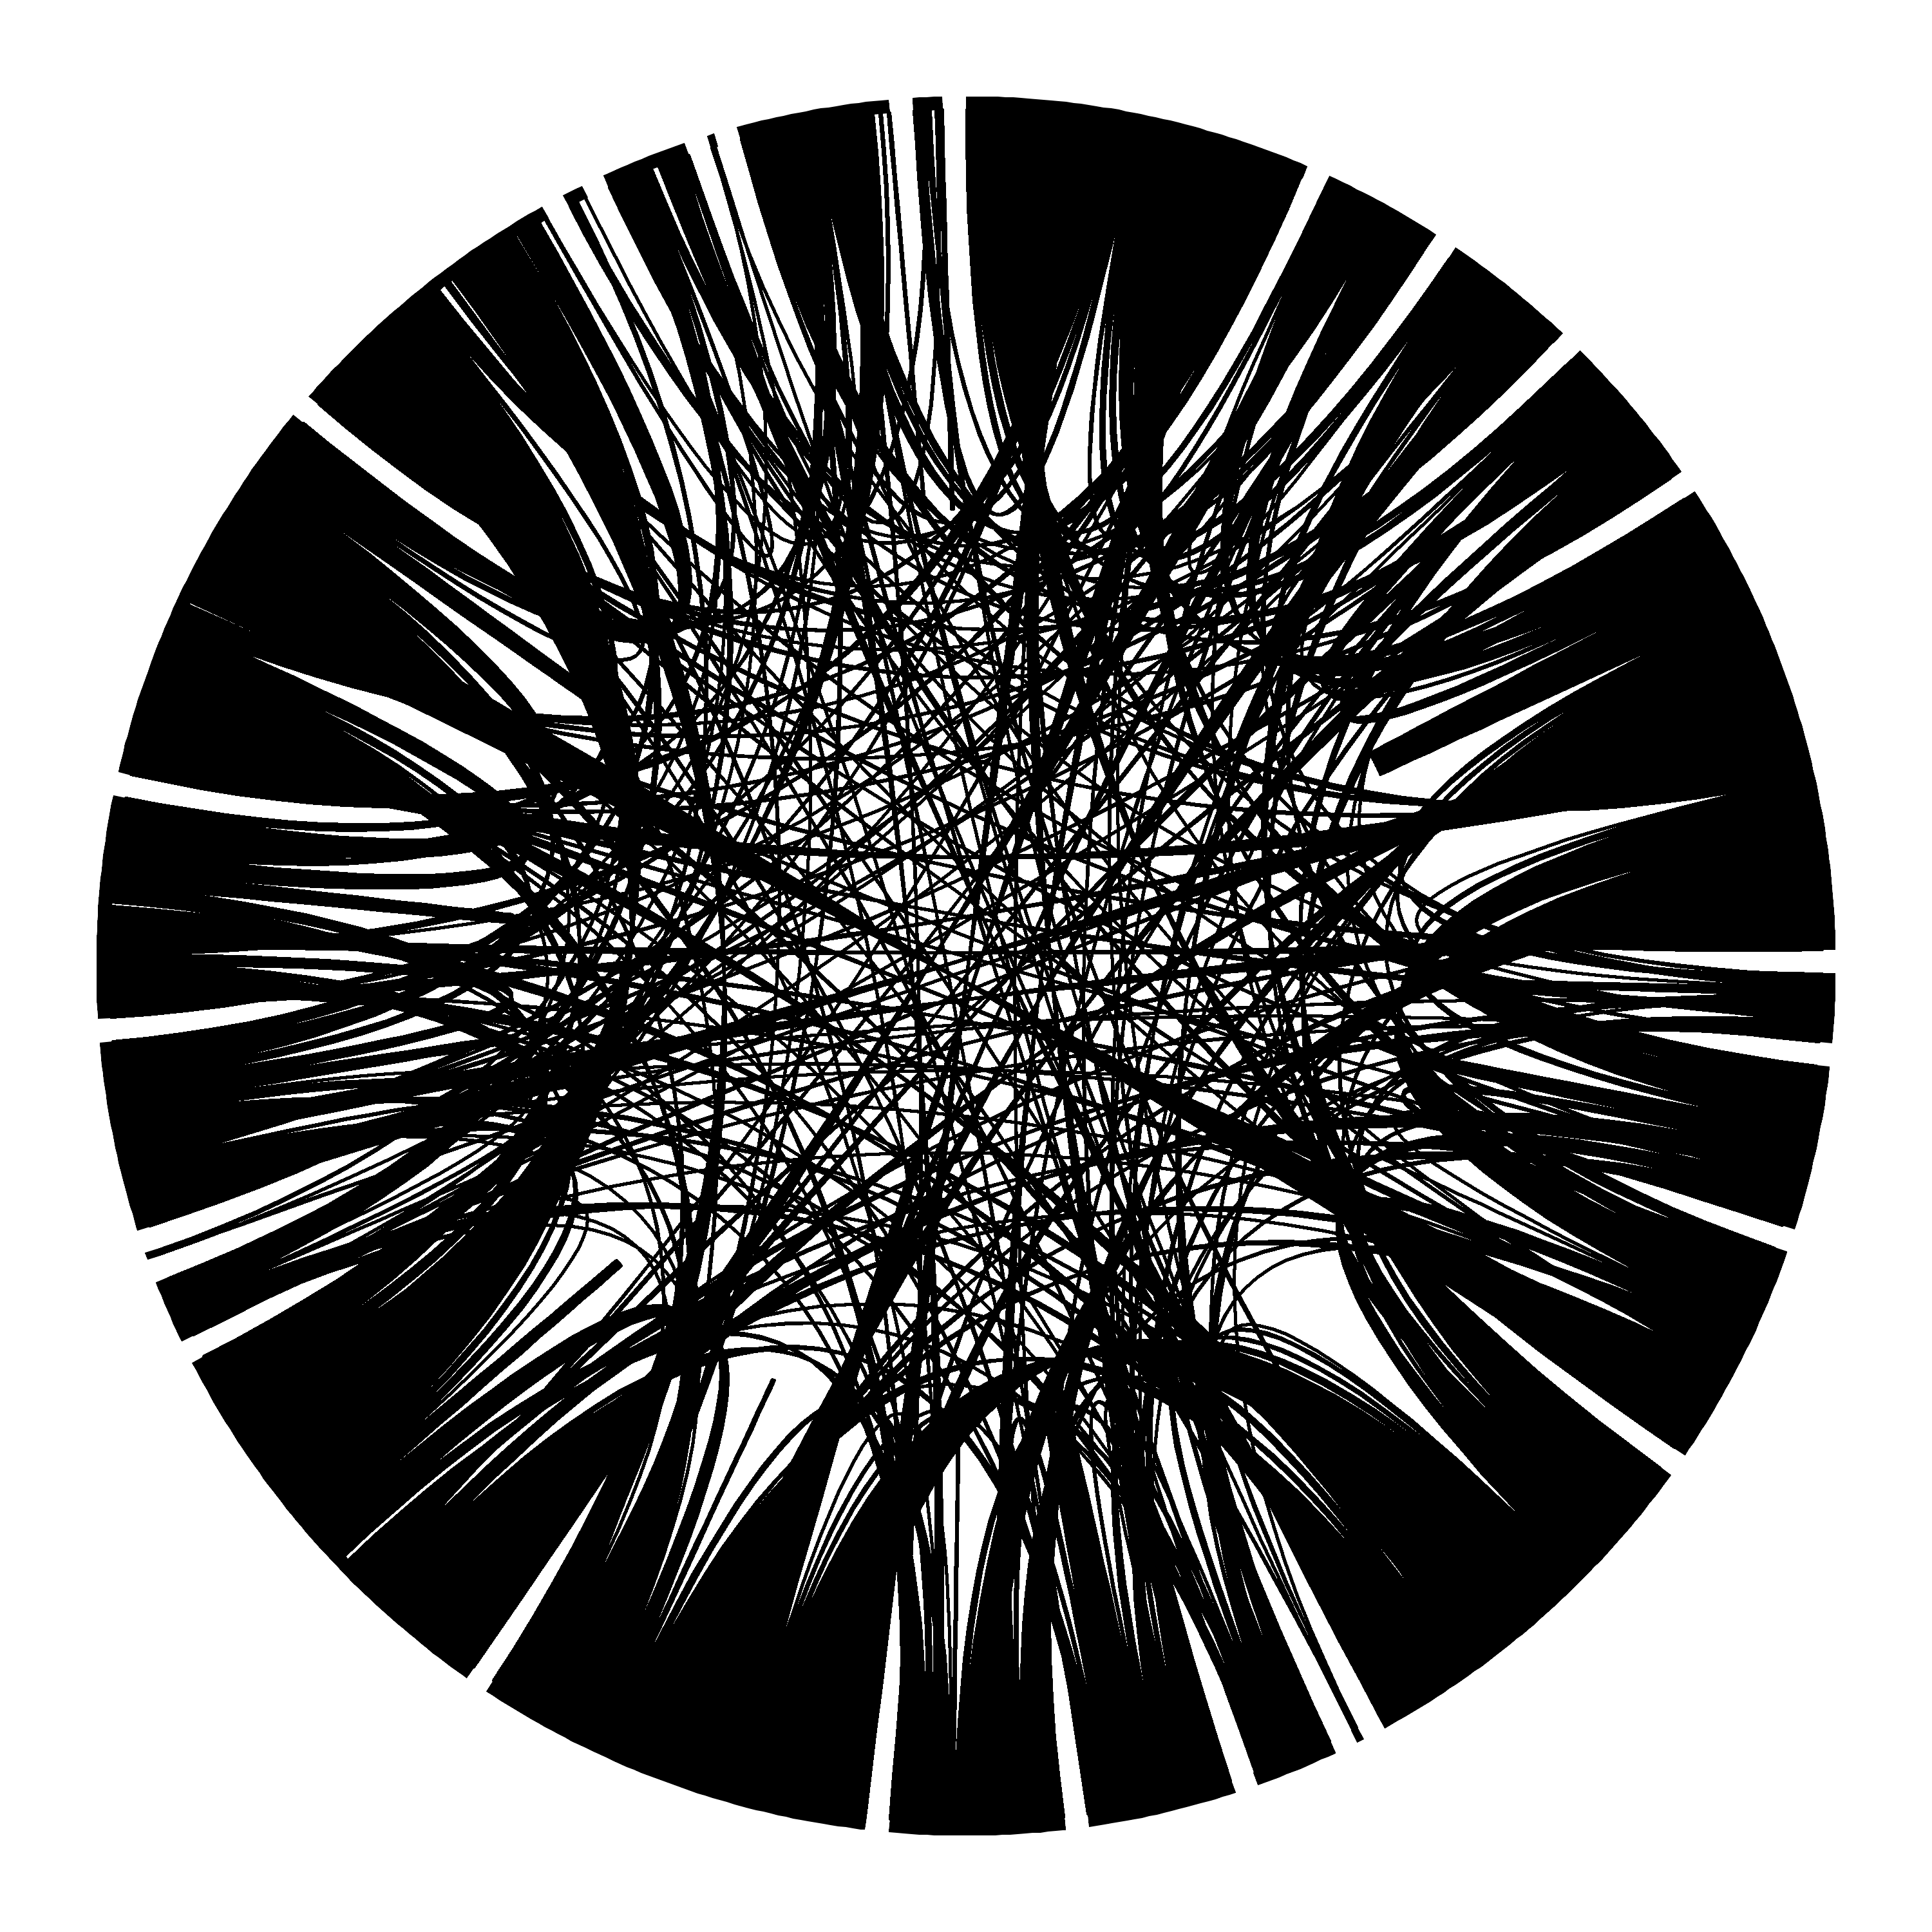
[top: atlas shrugged by ayn rand; bottom left to right: get low by lil jon and the east side boyz, gold digger by kanye west, ignition by r kelly, party up in here by dmx]
i also tried remaking the visualization in d3 during my time at the school for poetic computation. the version below spells out 'school for poetic computation' and adds a little bit of hover interactivity.